
Page 58 - 2023 OUTLINE OF THE MINISTRY OF THE INTERIOR REPUBLIC OF CHINA
P. 58
Land Administration
the jurisdiction of special municipalities/counties/cities, these price indices are derived from land
prices weighted by the size of the respective zone, and are compiled twice a year. On January 15
and July 15, the indices from September of the previous year and March of the current year are pub-
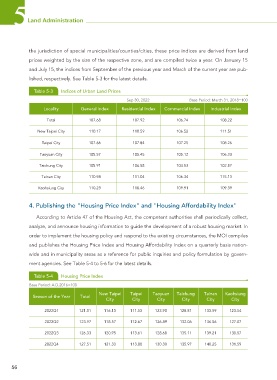
lished, respectively. See Table 5-3 for the latest details.
Table 5-3 Indices of Urban Land Prices
Sep 30, 2022 Base Period: March 31, 2018=100
Locality General Index Residential Index Commercial Index Industrial Index
Total 107.68 107.92 106.74 108.22
New Taipei City 110.17 110.59 106.52 111.51
Taipei City 107.66 107.84 107.25 108.26
Taoyuan City 105.57 105.45 105.12 106.33
Taichung City 105.91 106.58 104.53 102.87
Tainan City 110.98 111.04 106.34 115.13
Kaohsiung City 110.23 110.46 109.91 109.39
4. Publishing the "Housing Price Index" and "Housing Affordability Index"
According to Article 47 of the Housing Act, the competent authorities shall periodically collect,
analyze, and announce housing information to guide the development of a robust housing market. In
order to implement the housing policy and respond to the existing circumstances, the MOI compiles
and publishes the Housing Price Index and Housing Affordability Index on a quarterly basis nation-
wide and in municipality areas as a reference for public inquiries and policy formulation by govern-
ment agencies. See Table 5-4 to 5-6 for the latest details.
Table 5-4 Housing Price Index
Base Period: A.D.2016=100
New Taipei Taipei Taoyuan Taichung Tainan Kaohsiung
Season of the Year Total
City City City City City City
2022Q1 121.01 116.13 111.53 123.90 128.81 133.59 123.54
2022Q2 123.97 118.57 112.67 126.89 132.06 136.56 127.07
2022Q3 126.33 120.95 113.61 128.68 135.11 139.21 130.57
2022Q4 127.51 121.33 113.08 130.30 135.97 140.25 131.59
56