
Page 33 - 2023 OUTLINE OF THE MINISTRY OF THE INTERIOR REPUBLIC OF CHINA
P. 33
2023 OUTLINE OF THE MINISTRY OF THE INTERIOR
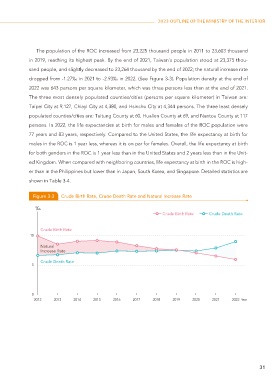
The population of the ROC increased from 23,225 thousand people in 2011 to 23,603 thousand
in 2019, reaching its highest peak. By the end of 2021, Taiwan's population stood at 23,375 thou-
sand people, and slightly decreased to 23,264 thousand by the end of 2022; the natural increase rate
dropped from -1.27‰ in 2021 to -2.93‰ in 2022. (See Figure 3-3). Population density at the end of
2022 was 643 persons per square kilometer, which was three persons less than at the end of 2021.
The three most densely populated counties/cities (persons per square kilometer) in Taiwan are:
Taipei City at 9,127, Chiayi City at 4,380, and Hsinchu City at 4,344 persons. The three least densely
populated counties/cities are: Taitung County at 60, Hualien County at 69, and Nantou County at 117
persons. In 2022, the life expectancies at birth for males and females of the ROC population were
77 years and 83 years, respectively. Compared to the United States, the life expectancy at birth for
males in the ROC is 1 year less, whereas it is on par for females. Overall, the life expectancy at birth
for both genders in the ROC is 1 year less than in the United States and 2 years less than in the Unit-
ed Kingdom. When compared with neighboring countries, life expectancy at birth in the ROC is high-
er than in the Philippines but lower than in Japan, South Korea, and Singapore. Detailed statistics are
shown in Table 3-4.
Figure 3-3 Crude Birth Rate, Crude Death Rate and Natural Increase Rate
‰
Crude Birth Rate Crude Death Rate
Crude Birth Rate
10
Natural
Increase Rate
Crude Death Rate
5
0
2012 2013 2014 2015 2016 2017 2018 2019 2020 2021 2022 Year
31