
Page 31 - 2023 OUTLINE OF THE MINISTRY OF THE INTERIOR REPUBLIC OF CHINA
P. 31
2023 OUTLINE OF THE MINISTRY OF THE INTERIOR
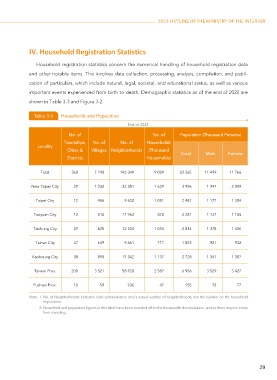
IV. Household Registration Statistics
Household registration statistics concern the numerical handling of household registration data
and other notable items. This involves data collection, processing, analysis, compilation, and publi-
cation of particulars, which include natural, legal, societal, and educational status, as well as various
important events experienced from birth to death. Demographic statistics as of the end of 2022 are
shown in Table 3-3 and Figure 3-2.
Table 3-3 Households and Population
End of 2022
No. of No. of Population (Thousand Persons)
Townships, No. of No. of Households
Locality
Cities & Villages Neighborhoods (Thousand
Total Male Female
Districts Households)
Total 368 7 748 143 349 9 089 23 265 11 499 11 766
New Taipei City 29 1 032 22 381 1 639 3 996 1 947 2 049
Taipei City 12 456 9 622 1 051 2 481 1 177 1 304
Taoyuan City 13 516 11 963 878 2 281 1 127 1 155
Taichung City 29 625 12 524 1 034 2 814 1 378 1 436
Tainan City 37 649 9 661 717 1 853 921 932
Kaohsiung City 38 890 17 342 1 137 2 728 1 341 1 387
Taiwan Prov. 200 3 521 58 920 2 587 6 956 3 529 3 427
Fuchien Prov. 10 59 936 47 155 78 77
Note: 1. No. of Neighborhoods indicates each administrative area's actual number of neighborhoods, not the number on the household
registration.
2. Household and population figures in this table have been rounded off to the thousandth decimal place, and so there may be errors
from rounding.
29